How to interpret the metrics on your digital marketing report
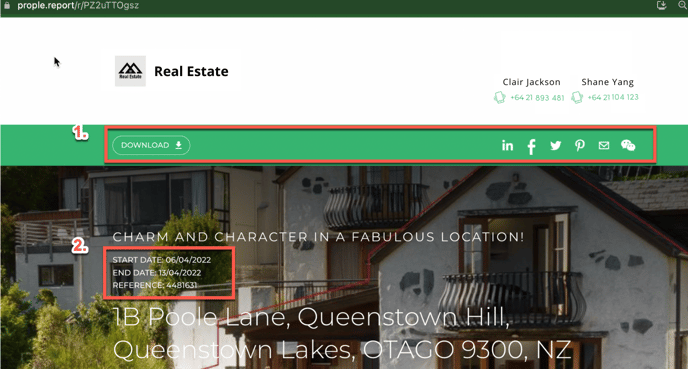
ListingLogic reports are on a single page for quick interpretation, and are easy to share with vendors. Your digital marketing report will be on a unique, shareable URL which looks similar to this: https://prople.report/r/PZ2uTTOgsz
Who is able to view the report?
Each report has a unique URL, and anyone who has access to the link may view the profile without login credentials.
You can also download the report as a printable PDF.
Sharing the report
Before you share the campaign here are a couple of things to check:
- Ensure you have the correct campaign
- Ensure the campaign start and stop dates are correct. These are found on the top left of a report
Even if a campaign has ended, you can look back at a historical report to see trends, and the audience segment most engaged with the property. This can help inform how you market future listings.
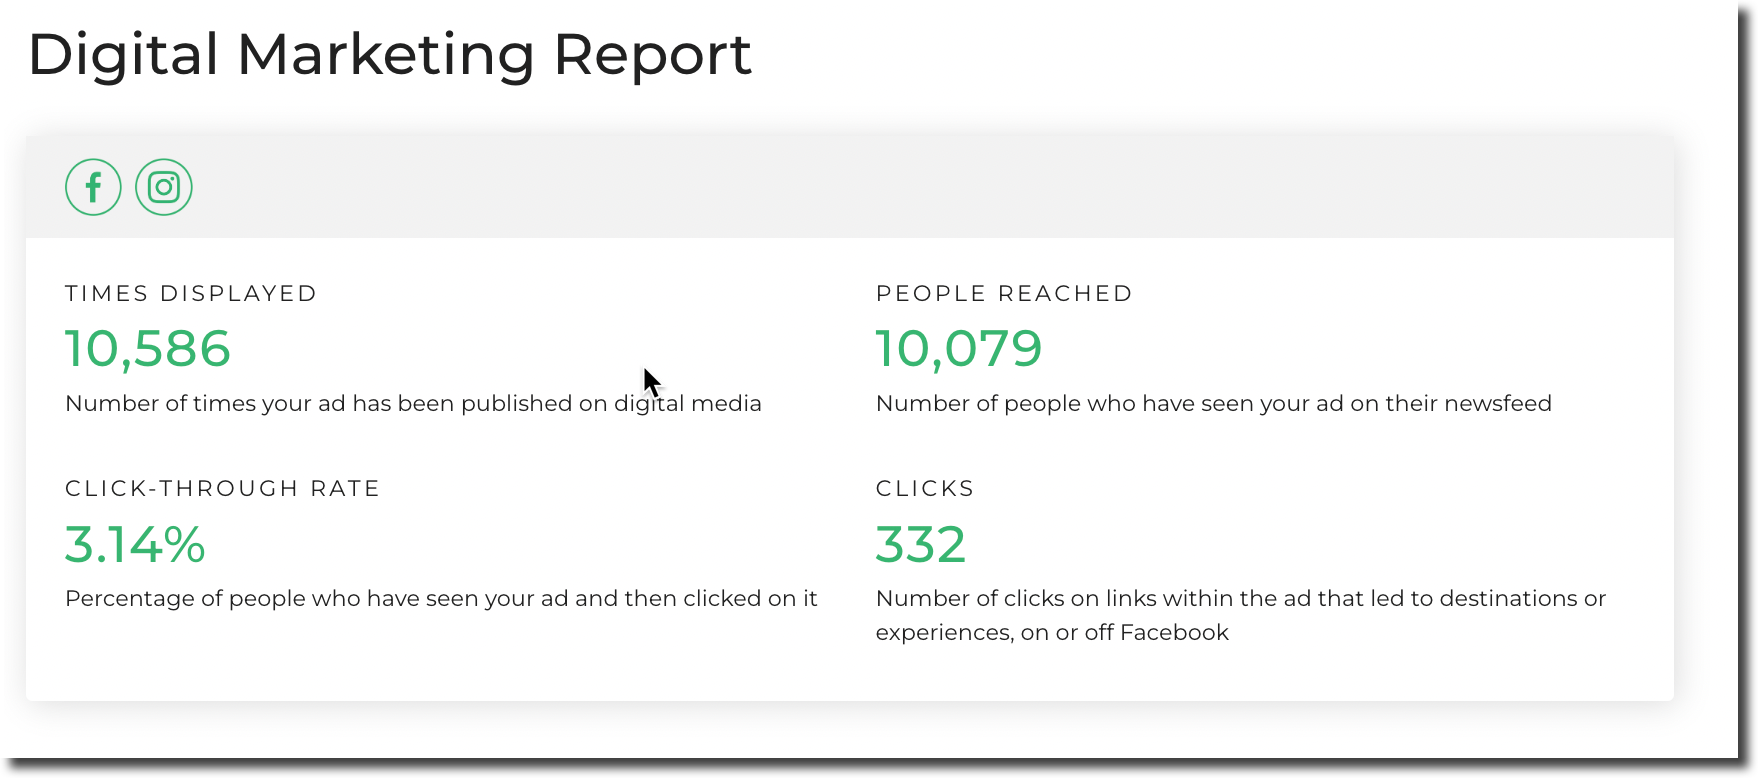
Your report at a glance
The top of the marketing report shows the status of the campaign. Simply put, the bigger the numbers, the more eyes have seen your campaign.
Remember campaigns are shown only to those who have displayed the right behaviours or interest in the properties you are selling. In this case 2BR/3BA residential homes.
The industry average for click through rates (CTR) is 1%.
Campaign preview and target geographies
Your campaign can be previewed via the "view ad" link. Note this is a Facebook preview and not the actual ad.
The map will indicate where the campaign is targeted. In this case the Auckland, Queenstown and Christchurch metro areas were selected.
.png?width=688&name=Bayleys%20%20Overview%20Video%20(1).png)
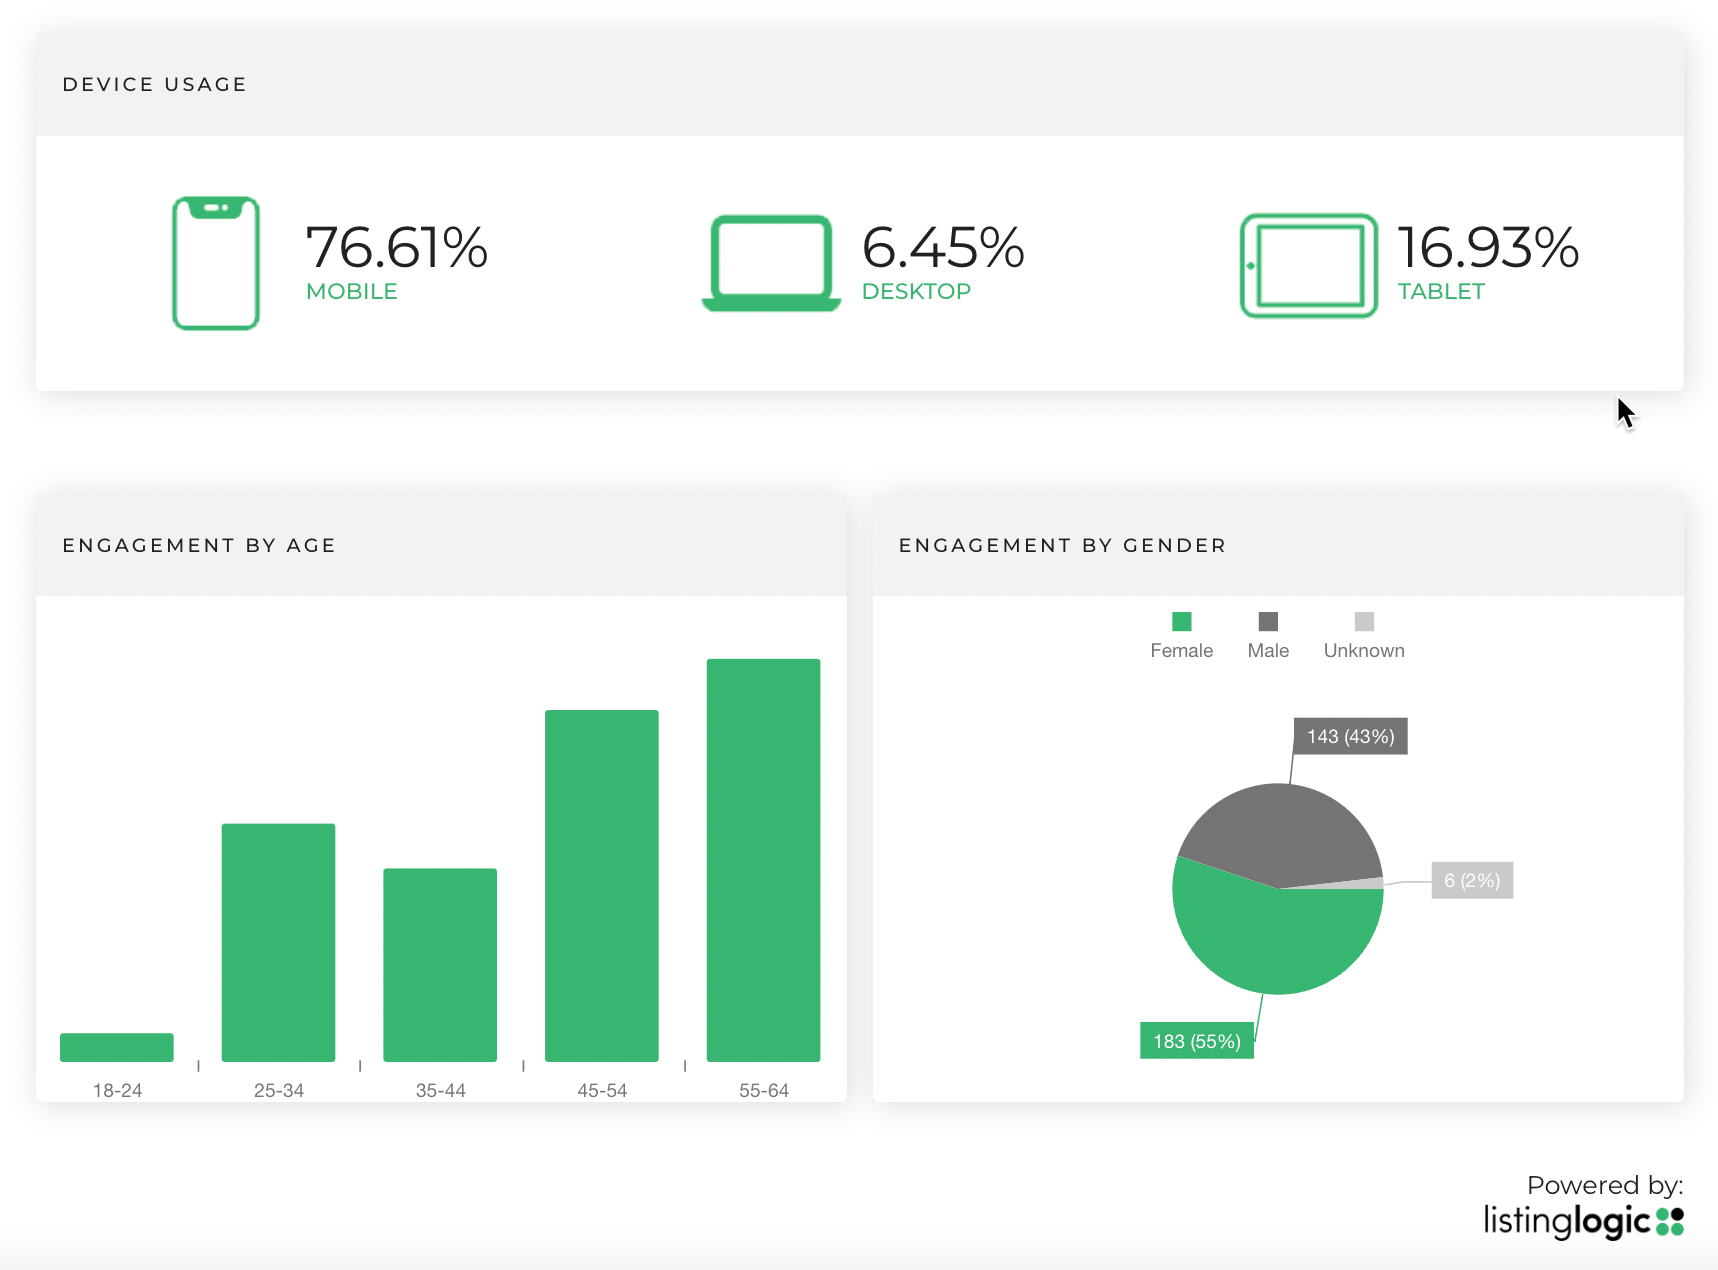
Demographics by age and gender
You can dive deeper and see more about the demographics interested in your campaign. This starts to tell you a powerful story about who is looking at this ad. In our example above we already know the main three metro areas being targeted but you can also see the age and gender of your primary audience? Does this match with those who are inquiring about the advertised property?
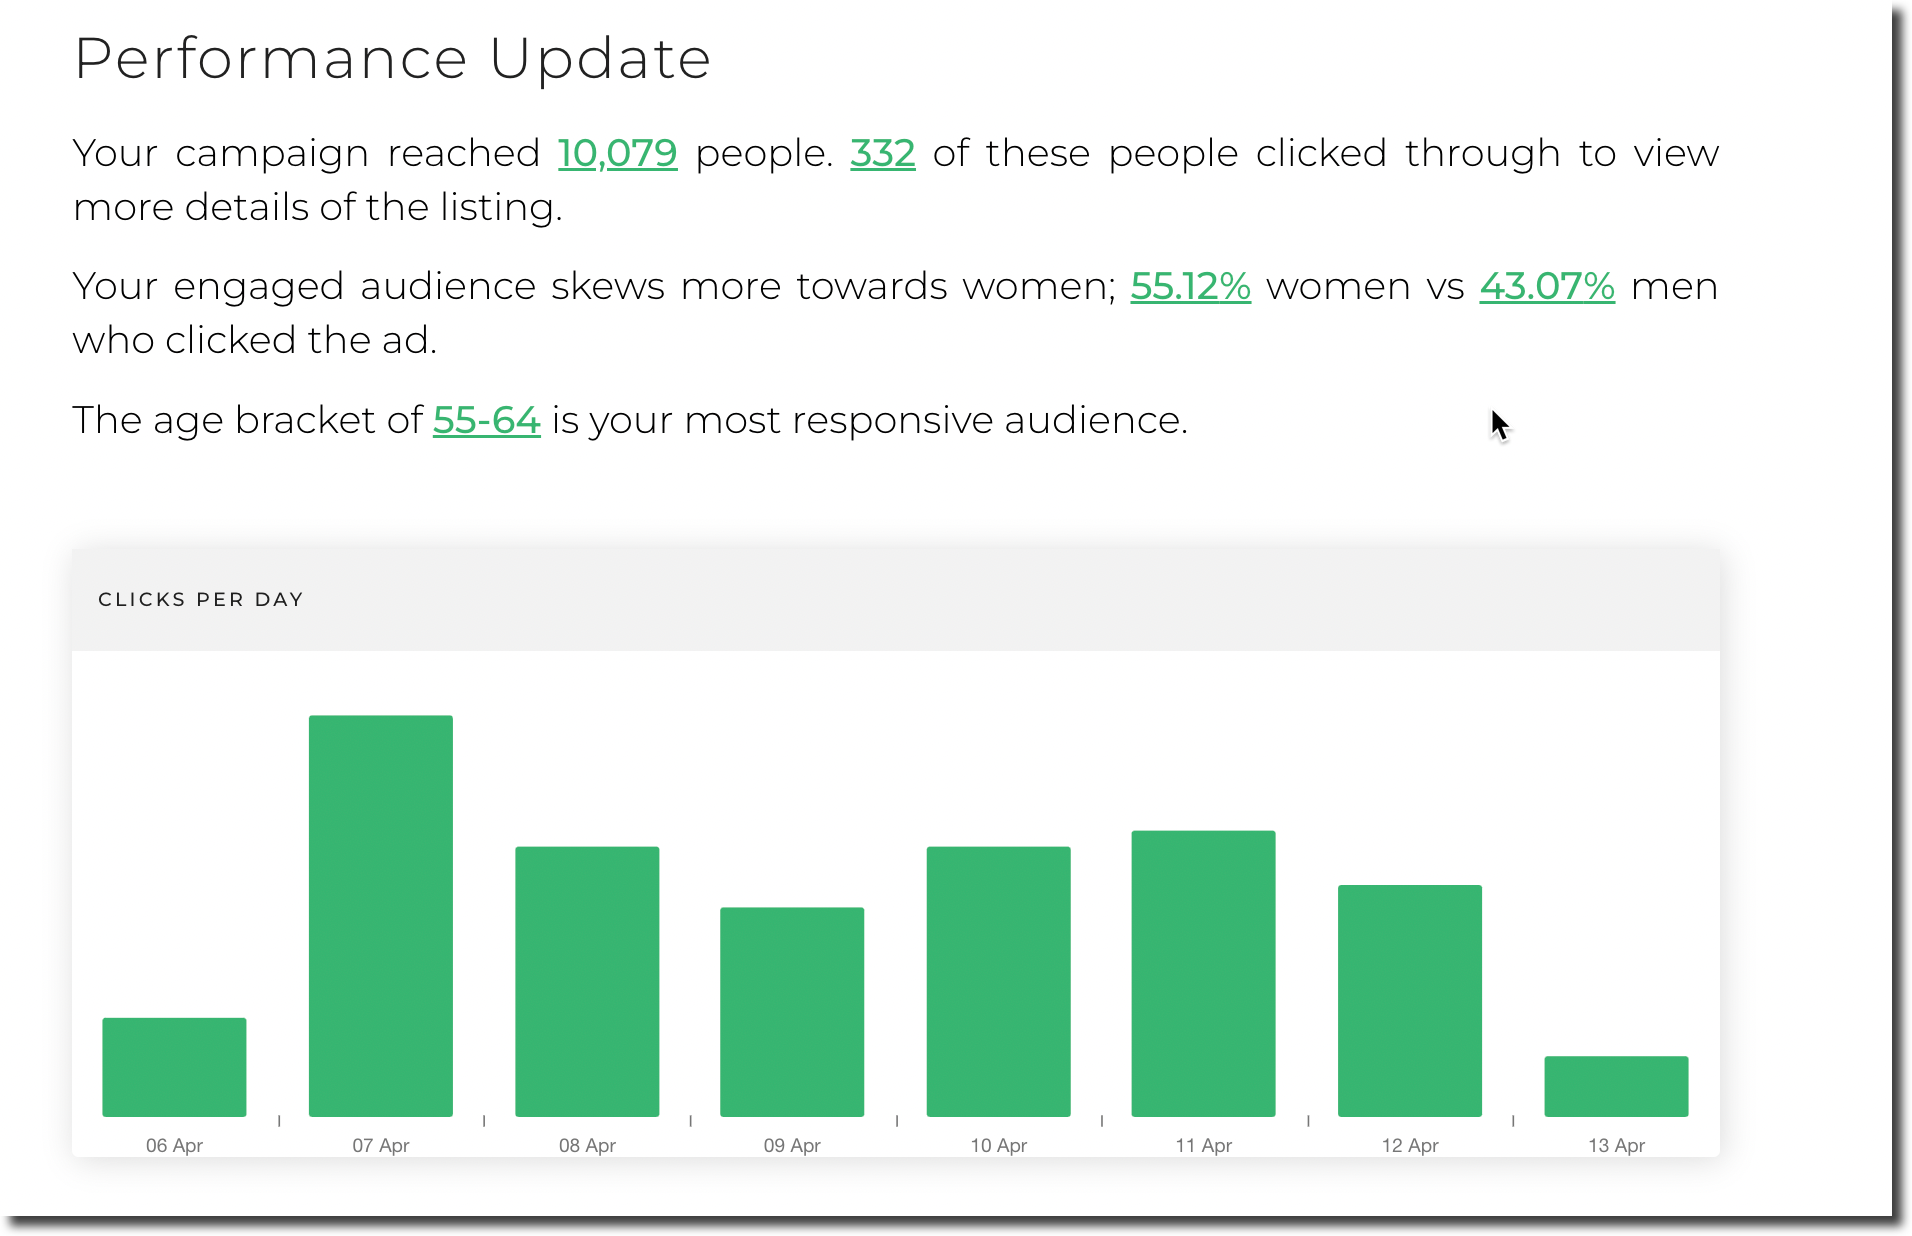
You can see below that this campaign was very well received by those 55 years and older. This doesn't mean younger people didn't view the ad, but your key audience is 55+. Statistically women tend to be the majority in viewing ads; the average is 60% women to 40% men.
Where is my campaign displayed most?
The answer is typically mobile devices. Most visitors to your campaigns (residential property) will be mobile/smartphone users.
When elderly visitors are engaged there is often some tablet use.